
Capturing data. While genetic analysis can be performed and investigated on an industrial scale in thousands of individuals in parallel, the analysis of clinical data is frequently still the domain of manual data curation. Clinical data is typically collected in a non-standardized way, which makes it difficult for information generated in a clinical context to be used in a systematic data analysis as can be performed with genomic data. However, the tide is turning, and we are slowly coming around to the idea that clinical data also requires the same degree of standardization in order to be used at scale. For none of the epilepsies is such standardization more important than for the rare epilepsies, which include many of the genetic epilepsies. Our lab has been working on frameworks and methods to allow for this kind of analysis in genetic epilepsies. Here is a brief summary of what it actually means to “make data speak”, which has become the mission statement of our lab.
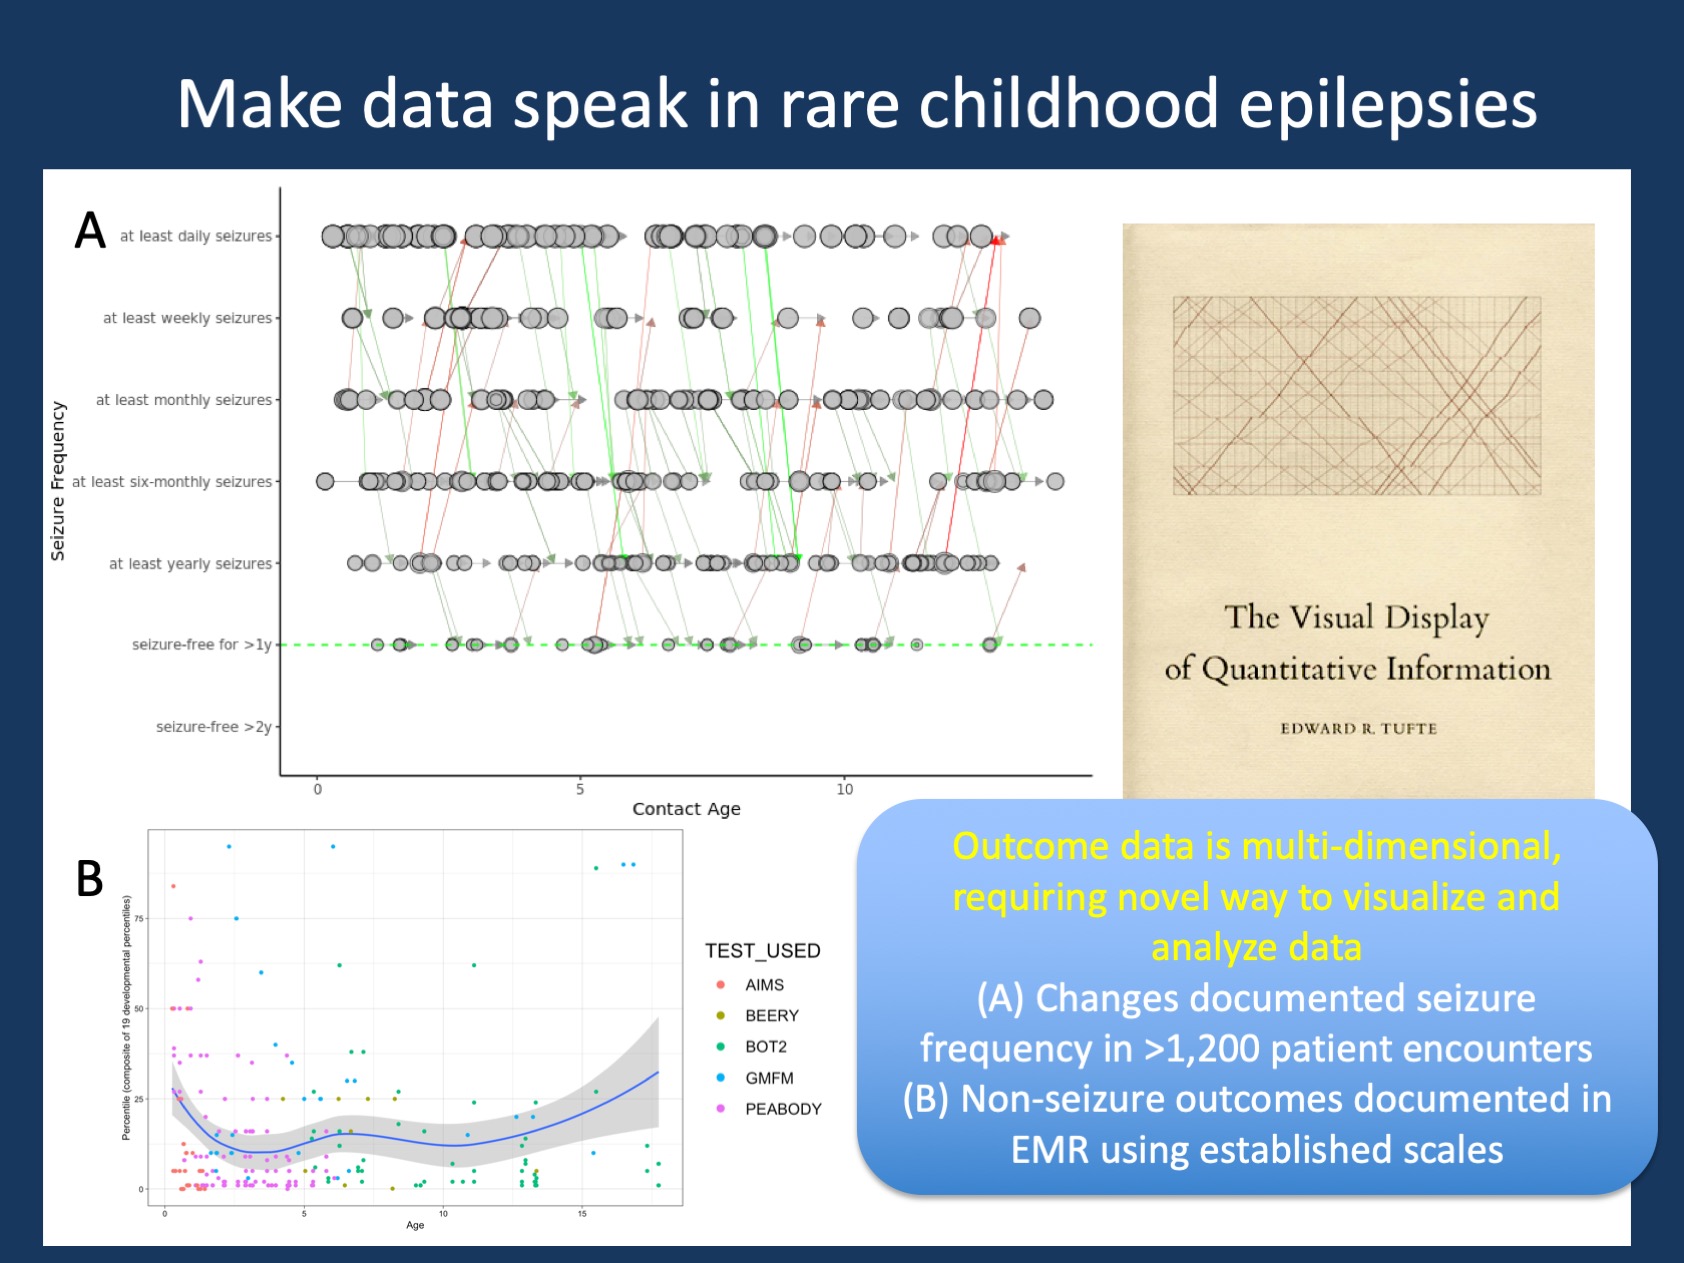
Figure 1. Analyzing standardized outcomes data implemented in the Electronic Medical Record for routine health care. (A) Documented seizure frequencies in >350 patients by age, arrows reflect changes in seizure frequency between encounters, green indicates improvement, red indicates worsening. This type of visualization for seizure frequencies over time has since been abandoned by our lab and replaced by more intuitive ways of making this data more tangible (CNS 2020 poster by Fitzgerald et al.). However, this plot bears some resemblance to one of the most famous historical data visualizations, the Maury train chart as displayed on the cover of Edward Tufte’s book. (B) Non-seizure outcomes data in >800 children with genetic epilepsies, using percentiles for routine scales used in clinical care (AIMS, Beery, BOT2, GMFM, Peabody). This graph emphasizes that many children with genetic epilepsies have relatively low scores on established scales that may not allow for sufficient discrimination.
Moving to Dataland. This blog post has been much longer in the making that it might seem. In fact, I have a draft sitting in our WordPress framework that was meant to be published in 2017 when our lab moved to “Dataland,” the Roberts Center for Pediatric Research across the Schuykill from CHOP. However, I had little to talk about back then, especially as I have realized that blogging about good intentions rather than actual results is often not that convincing. Now, three years later, our lab has finally launched its website (helbiglab.io), we have published several of our data-driven publications in the rare epilepsies (with several more in the pipeline), and we have taken a stab at thinking about standardizing epilepsy outcome data for large-scale analysis.
Outcomes. I recently submitted a suggestion for the 2020 NINDS Transformative Research Priorities for the Epilepsies entitled “Large-scale clinical data and outcomes in rare epilepsies” (link), emphasizing the need to not only make large-scale clinical data available in standardized formats, but to also make sure that both seizure outcomes and non-seizure outcomes are captured. However, except for a few centers where such information is already collected at scale, it will take a while until such data sources are available. Until then, other data can already “speak” for us – this blog post should help you understand why we are currently doing what we are doing and how the existing data is already helpful in understanding natural histories of rare epilepsies.
Why data? Let me address the “why” first. Our group develops and applies tools like semantic similarity analysis on Human Phenotype Ontology (HPO) data (link), data harmonization and analysis from the Electronic Medical Records (link), and various other projects that aim at analyzing both common and rare neurological disorders through available data sources, such as our telemedicine healthcare analytics projects (link). Why? Let me first state that this question is perfectly justified: clinical studies have traditionally been the domain of manual chart review. We have participated in 50+ genotype/phenotype correlation studies to delineate the phenotypic spectrum of rare genetic epilepsies. So why would we need anything in addition to this? The answer is that we are always one step behind. We live in a world where data-driven instant feedback is possible and is also increasingly used for healthcare. So why don’t we invest in systems that can answer questions such as “Given all your available data in >10,000 patients with epilepsy over the last 10 years, what is the most common genetic diagnosis in a 6 month-old child with new-onset Infantile Spasms? What is the most effective treatment?”
Answer we already have. To make a long story short, we can already answer the first part of the question(the gene is STXBP1), using data of more than 3,200 patient years in rare genetic epilepsies. However, in order to get answers like this, we need to adjust our analysis to what the data is like. This may seem unusual at first – why should an answer to clear clinical questions make any concessions to what the data is like? The answer is the following: we can gain so much more with achieving 80% through analysis or large-scale data rather than aiming for 100% in a small, manually reviewed data set. Our lab is trying to build natural histories based on data that is already there, using existing healthcare data that is 100-1000x larger than what any single group could accomplish with manual chart review. However, in order to accomplish this, we need to understand the “data language”. By the way, our initially reported dataset has increased to more than 5,000 patient years by the time of this blog post.
Beyond data poetry. Let me just jump forward and skip the entire data science pep talk. What exactly does it mean to let data speak? Here is one example. We now have access to more than 500,000 phenotypic annotations in neurodevelopmental disorders and genetic epilepsies mapped to the common Human Phenotype Ontology (HPO), which you will hear more about in future blog posts. Our philosophy is as follows: every data point may not be meaningful at all and some of the data may be quite shallow, maybe even inaccurate. However, when considered as an entire dataset, this information may add new information. By understanding how data speak, we refer to our concepts to analyze such as dataset, finding meaningful representations of concepts such as phenotyping depth, phenotypic resemblance, or width of a phenotypic spectrum. The discussions are often technical, but the implications are clinical.
What is already possible. There are some areas of clinical data relevant to the epilepsies that we already feel comfortable with and that we can analyze at scale from healthcare data, including EMR usage, diagnoses and medication prescriptions. This may seem disappointing at first, but with some ingenuity, we can rephrase common clinical questions in a way that allows us to answer them. We might not be able to assess which medication is most likely to provide the best outcomes in new-onset Infantile Spasms through large-scale data analysis, but we can assess what anti-seizure medications were prescribed, whether patients required anti-seizure medications, and what the follow-up diagnoses were. Given that such an approach can run virtually in real-time across entire healthcare systems, it can be used to inform treatment, providing the general framework of a learning healthcare system. Having worked with EMR and genomic data for the last five years, take my word for it: this is already possible – we just need to adjust our ears and learn how listen to “dataspeak” in rare disorders.
Answer we still need. Much can already be accomplished through data harmonization, mapping to common frameworks, and subsequent analysis. However, there are entire concepts that we still cannot grasp through these methods. These include seizure outcomes and non-seizure outcomes. In an upcoming blog post, we will highlight the ELHS/PELHS ([Pediatric] Epilepsy Learning Health Systems) that we are involved in that will focus on a standardized description of seizures outcomes in Electronic Medical Records (Figure 1). Non-seizure outcomes require more standardization, but will be the next major step in standardization of routine clinical data documentation. Having data in such a way will guarantee that a systematic analysis can be performed not only from limited research data, but from the hundreds of daily routine clinical appointments that reflect the ongoing care that is provided for children with rare genetic epilepsies.
What you need to know. Large-scale analysis of clinical data in rare epilepsies is the new frontier. Two components are critical to facilitate this analysis, including (1) the harmonization and mapping of already existing data that is often more informative than you would think, and (2) the systematic implementation of novel concepts into routine clinical documentation, such as EMR-based documentation of seizure frequencies and non-seizure outcomes. Both domains require us to “learn how to speak data” and establish the ground rules on how such data can be used and analyzed. This will allow us to use existing healthcare data in a systematic way to guide decision-making in rare childhood epilepsies, including real-time clinical decision support. Testing and evaluating these tools will slowly become a separate discipline as the “natural laws” of this new science becoming clearer.
Ingo Helbig is a child neurologist and epilepsy genetics researcher working at the Children’s Hospital of Philadelphia (CHOP), USA.
