
Genetic architecture. Our reference dataset for genetic variation in humans has become so large that we can increasingly ask the question whether the distribution of genetic variants tells us something about genes and regions within genes without knowing anything about what these genes actually do. For example, it is well established that genes with fewer protein-truncating variants than expected are much more likely to be causative genes for epilepsy and neurodevelopmental disorders than genes that have an average number of these variants. A recent publication in Nature Genetics takes this approach one step further by looking at specific regions within genes rather than entire genes, a somewhat interesting approach that the authors introduce by discussing bullet damage to airplanes in World War II.
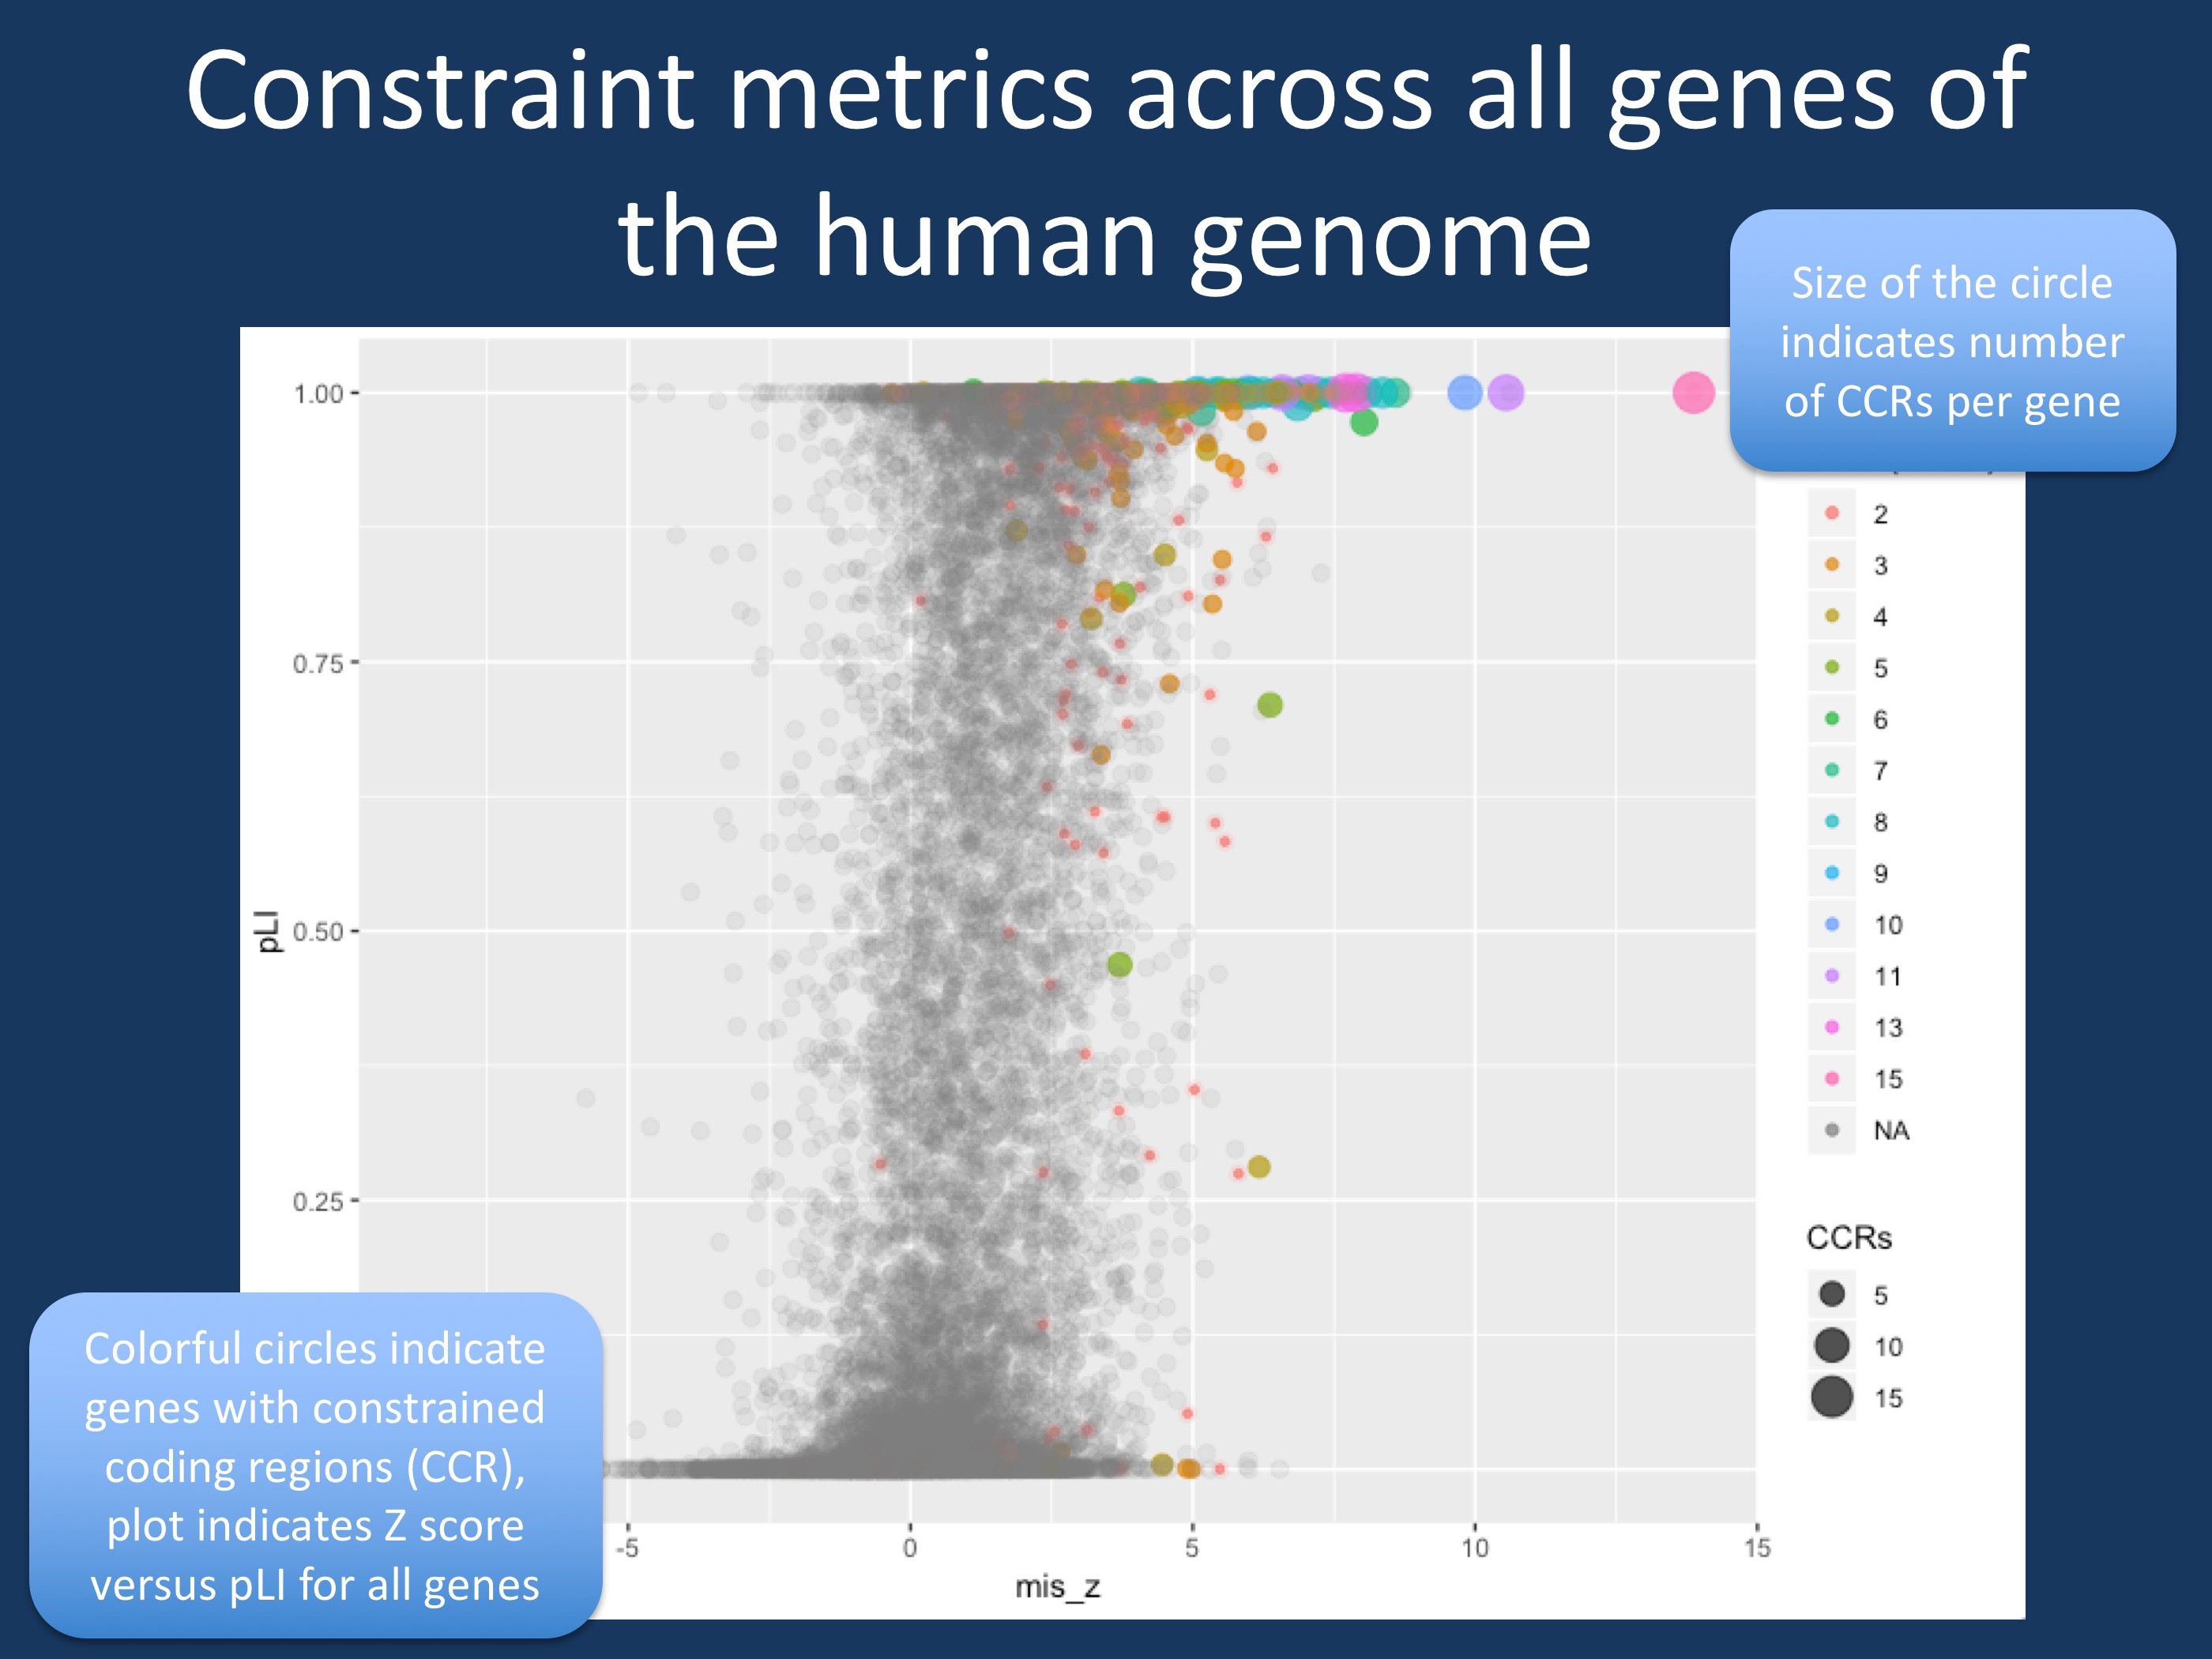
Figure 1. Comparison of Z-score, pLI and presence of constrained coding regions (CCRs) > 99th percentile in all genes in the human genome. Z-score indicates a gene’s intolerance to missense variants, pLI represents the probability of loss-of-function; the closer pLI is to one, the more intolerant the gene appears to be to loss of function. CCRs are regions in the human genome that are depleted for variation, which can be ranked by percentiles; CCRs above the 99th percentile are highly constrained. Genes with >99th CCRs are indicated in color. The size of the circle indicates the number of CCRs per gene. While most genes with CCRs have a high Z-score and high pLI, there are several genes with CCRs that are not particularly significant using Z-score and pLI, which represent whole-gene constraint measures. These gene may be hidden neurodevelopmental genes if variants fall into the specific CCRs of these genes. The R script that I used to generate this plot can be found on GitHub.
Statistical research group and WWII. It is somewhat unusual for a Nature Genetics article to take a historical detour, which is the reason why I think this story is worth sharing. In World War II, the statistical research group suggested to armor allied planes in areas of the plane where bullet holes were not seen in planes returning from their mission, suggesting that bullet damage to these specific areas must have resulted in critical damage to the planes that did not return from their mission. Havrilla and collaborators use this example to suggest an analogy to the genetic variation seen in humans. While the occurrence of mutations is random, the variation seen in healthy individuals will show lack of genetic changes where genetic changes will result in disease or embryonic lethality. Accordingly, these regions are where we need to look for disease genes.
Constraintology. Looking at differences in variation within the human genome in the context of neurological disorders is not new. A few years ago, we discussed the RVIS score on our blog and the measures such as the missense (Z) score and pLI are used in the ExAC and gnomAD databases to compare variation of missense variants and protein-truncating variants in a given gene to what is expected based on all genes in the human genome and the size of the gene. For example, SCN1A has a Z-score of 5.52 and pLI of 1.00 in the gnomAD database, suggesting that we see much fewer variants in SCN1A than we would expect. These genes are called “constrained” and several other measures have been developed to assess which genes and which regions within genes are constrained with the aim to find strategies to identify disease genes and particular regions within genes that may be harboring disease-causing mutations. Given that these methods do not account for what a gene actually does, they provide an interesting independent approach to zoom in on potentially relevant regions – a sort of genomic clairvoyance.
The CCR map. Havrilla and collaborators established a genomic map of constrained coding regions (CCRs). Based on the observation of one variant every seven base pairs on average in the gnomAD database, CCRs are regions within genes where this average variant frequency is reduced. The regions with the lowest number of variants are then the CCRs with the highest percentile. The authors found that the CCRs are not randomly distributed within genes. Only 512 genes have CCRs in top 99th percentile, many of them known disease genes. In a way, you can think of CCRs as particular spots in the human genome – small regions where very little variation between healthy individuals is found. For example, SCN1A, SCN2A, and SCN8A have several CCRs with up to 13 CCRs in the SCN8A gene. This provides an interesting new concept on how we should think about some of our disease genes – rather than considering the entire gene, you could think of smaller modules in these genes that may be disease-causing. The KCNQ2 gene is particularly highlighted by the authors: while some regions within KCNQ2 are CCRs, there are other regions in KCNQ2 where population variation is not much different than in the remainder of the human genome. These considerations are not yet integrated into guidelines on how we assess variants in known epilepsy genes, but given the robustness of these findings, this may be on the horizon.
Potentially missed epilepsy genes. The example of KCNQ2 is very interesting. What if a gene has CCRs, but has lots of other variations in other parts of the gene so that the overall “constraint” of this gene is effectively neutralized? To ask this in a different way: are there potential candidate genes for epilepsy and neurodevelopmental disorders that may have escaped our attention, as we wrote them off as too variable in the human genome? The answer is yes, but not too many (Figure 1). For this blog post, I have used the publicly available data from Havrilla and collaborators and ExAC data to find out which genes may have fallen through the cracks (this information is not yet available for gnomAD). For the most part, gene-wide reduction in protein-truncating variants, missense variants and presence of CCRs are aligned. You can see the cluster of colorful circles in the upper right corner of Figure 1. However, there are also a few genes that have rather unimpressive Z-scores (missense) and pLIs (protein-truncating) that still have CCRs. When you look at genes that are lower than the 50% percentile for Z-scores and pLI, EPPK1, PIGN, NACA, ZNF595, WDR19, and RIN2 are genes with 2 CCRs within the 99th percentile. These six genes are variable within the human genome, but have two regions that are highly constrained. Accordingly, variants in these regions may be disease-causing. In addition, there are 11 genes that do not have pLIs or Z-scores in the ExAC database, including known disease genes such as FOXG1 and NR2F1. Two additional genes have 3 CCRs (LMTK3, ZBTB7A), also indicating that they may be future disease genes.
What you need to know. The publication by Havrilla and collaborators has a simple message: forget about entire genes when you look at density of variants across the genome and focus on specific regions within these genes. While I only discussed a subset of the data presented by Havrilla and collaborators, these findings may be relevant for neurogenetics – constraint measures are increasingly used when novel genes are assessed, but they may be highly misleading in some instances. On a genomic basis, regions rather genes are where disease-causing variants will be found, particularly in genes where missense mutations play a prominent role.
Ingo Helbig is a child neurologist and epilepsy genetics researcher working at the Children’s Hospital of Philadelphia (CHOP), USA.
